As applications grow in scale and complexity, managing logs becomes increasingly important. This blog focuses on setting up a reliable and scalable logging pipeline using Grafana Loki for log aggregation and Promtail for log collection, helping you gain better visibility into your applications.
Download
git url : https://github.com/grafana/loki/releases
loki : https://github.com/grafana/loki/releases/download/v3.6.3/loki-linux-amd64.zip
promtail : https://github.com/grafana/loki/releases/download/v3.6.3/promtail-linux-amd64.zip
unzip and Copy binary file at /usr/local/bin/.
Download loki config file:
- Local-Configuration-Example.yaml: https://grafana.com/docs/loki/latest/configure/examples/configuration-examples/
# This is a complete configuration to deploy Loki backed by the filesystem.
# The index will be shipped to the storage via tsdb-shipper.

auth_enabled: false

server:
  http_listen_port: 3100

common:
  ring:
    instance_addr: 127.0.0.1
    kvstore:
      store: inmemory
  replication_factor: 1
  path_prefix: /tmp/loki

schema_config:
  configs:
  - from: 2020-05-15
    store: tsdb
    object_store: filesystem
    schema: v13
    index:
      prefix: index_
      period: 24h

storage_config:
  filesystem:
    directory: /tmp/loki/chunks
- Configuring Promtail file : https://grafana.com/docs/loki/latest/send-data/promtail/
 server:
  http_listen_port: 9080
  grpc_listen_port: 0
positions:
  filename: /var/lib/promtail/positions.yaml
clients:
  - url: http://localhost:3100/loki/api/v1/push
scrape_configs:
- job_name: system
  decompression:
    enabled: true
    initial_delay: 10s
    format: gz
  static_configs:
  - targets:
      - localhost
    labels:
      job: varlogs
      _path_: /var/log/**.gz
Note: check out my Git repo to find Working conf file.
Create Loki Service
Edit : vi /etc/systemd/system/loki.service
[Unit]
Description=Node Exporter
After=network.target
[Service]
User=root
Group=root
Type=simple
ExecStart=/usr/local/bin/loki-linux-amd64 -config.file=/opt/loki/loki-local-config.yaml
[Install]
WantedBy=multi-user.target
Start Service
systemctl start loki.service
systemctl enable loki.service
systemctl status loki.service
Create promtail service
Edit : vi /etc/systemd/system/promtail.service
[Unit]
Description=Node Exporter
After=network.target
[Service]
User=root
Group=root
Type=simple
ExecStart=/usr/local/bin/promtail-linux-amd64  -config.file=/opt/promtail/promtail-local-config.yaml
[Install]
WantedBy=multi-user.target
Start Promtail Service
systemctl start promtail.service
systemctl enable promtail.service
systemctl status promtail.service
Grafana
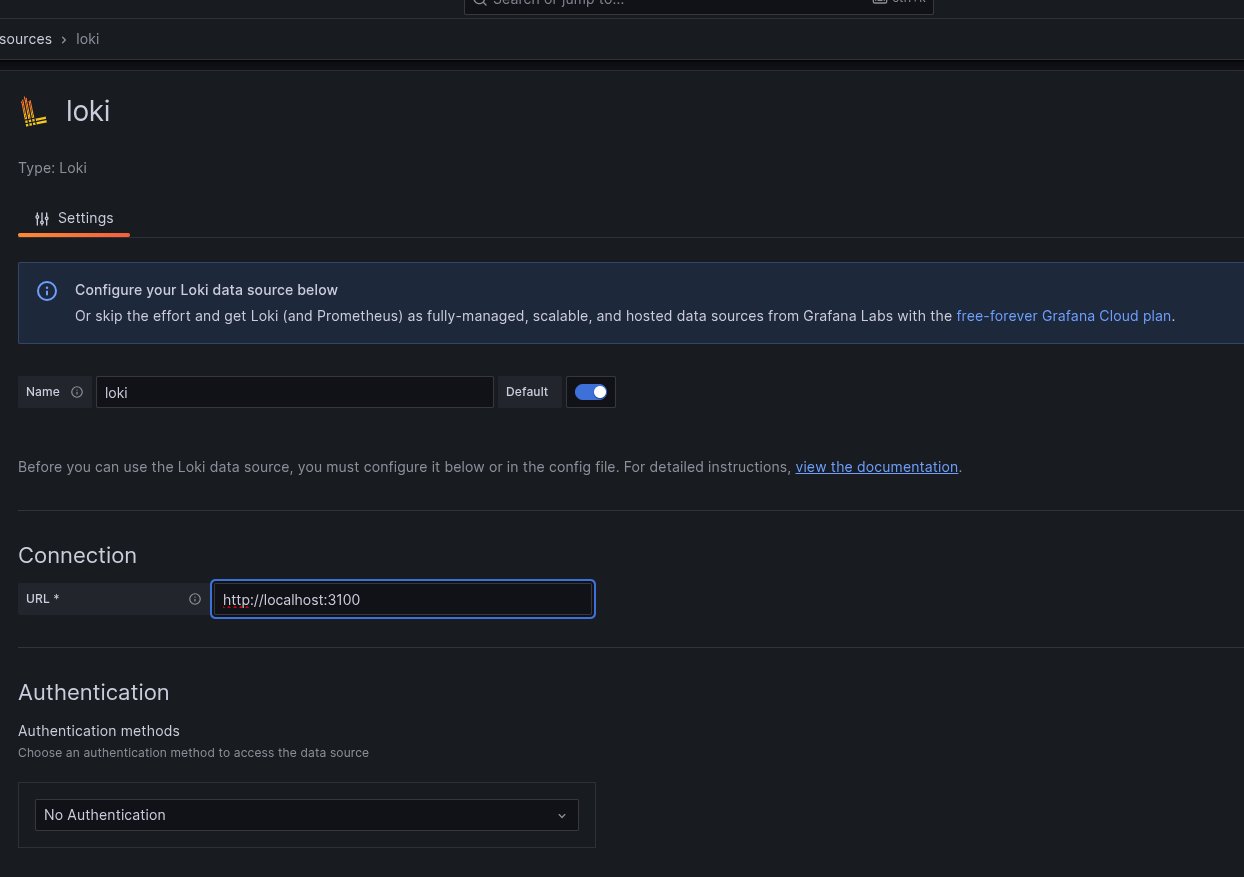
- Add DataSource:
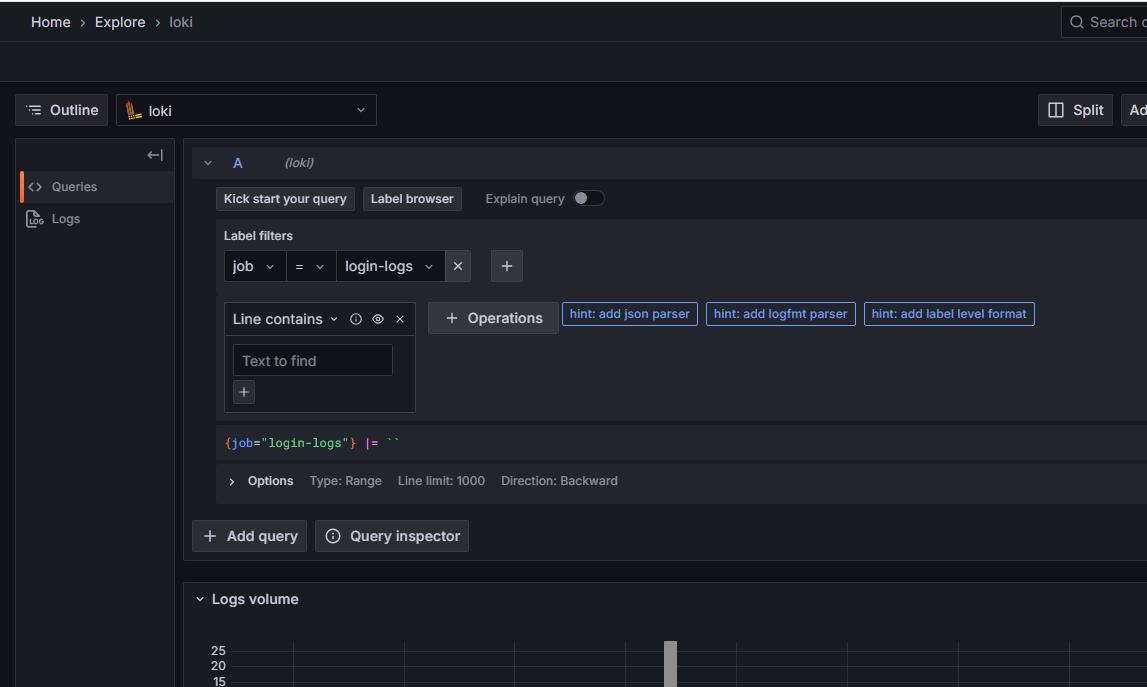
- Verify Data from Explore option:
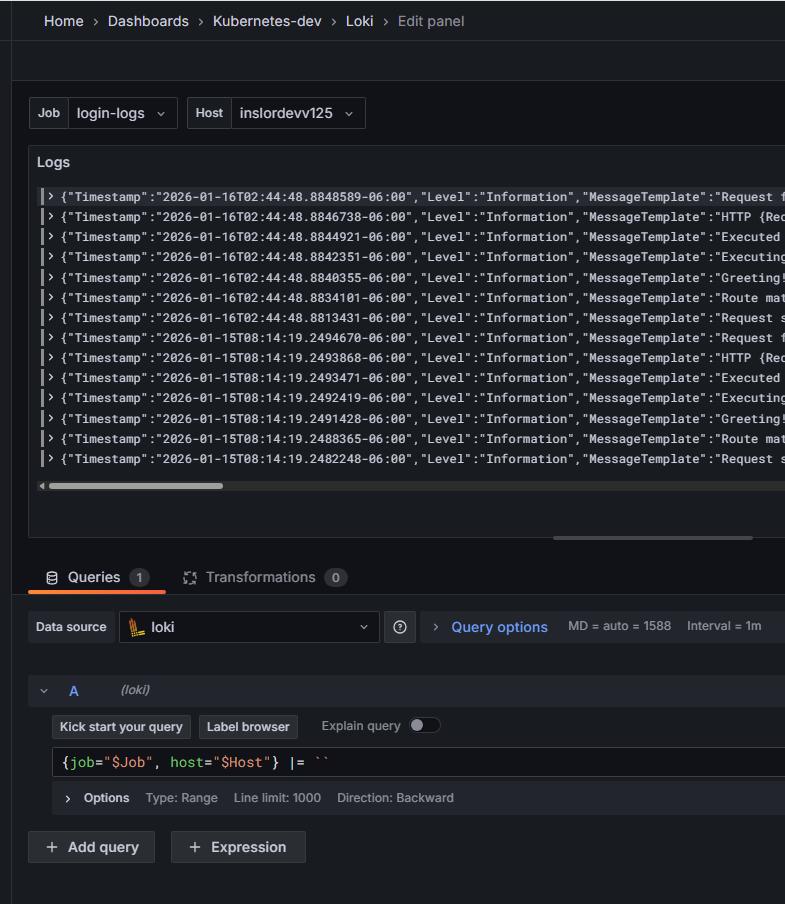
- Create Dashboard:
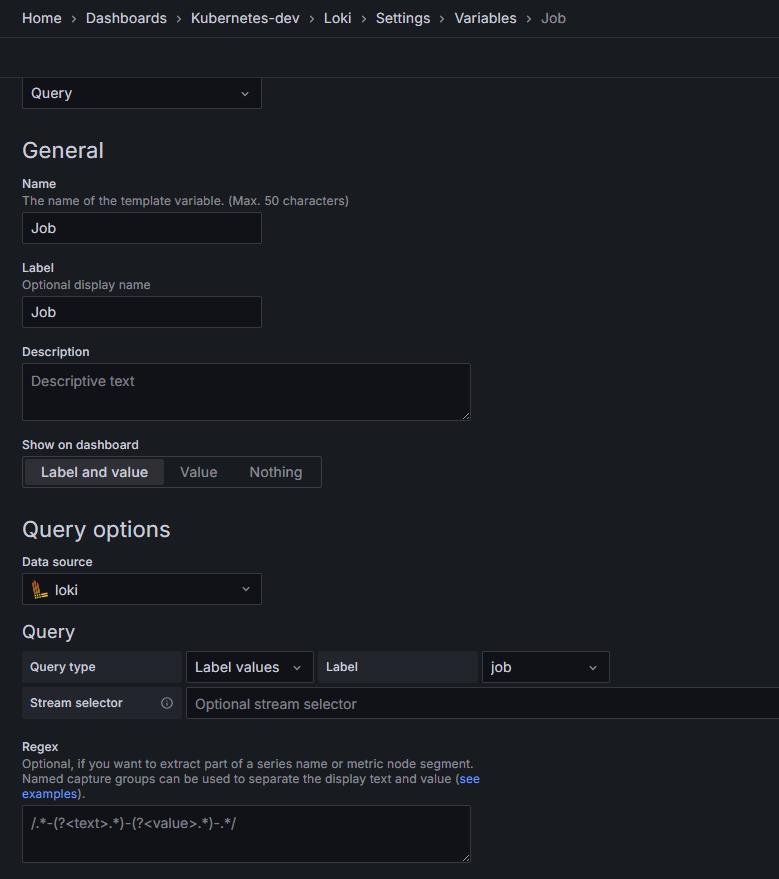
- Add Variable for Dashboard: