Setting up the Kubernetes Dashboard is a great way to get a visual interface for managing your cluster. There are few dashboards available online which are also open source like offical kubernetes Dashboard or KubeSphere. Here’s a step-by-step guide to get you going quickly.
Kubesphere
Download Helm :
curl https://raw.githubusercontent.com/helm/helm/main/scripts/get-helm-3 | bash
Install KubeSphere Core
# If you are accessing charts.kubesphere.io from a restricted location, replace charts.kubesphere.io with charts.kubesphere.com.cn
helm upgrade --install -n kubesphere-system --create-namespace ks-core https://charts.kubesphere.io/main/ks-core-1.1.4.tgz --debug --wait
- Wait for Deployment Completion Confirm that all KubeSphere components are running by executing the following command:
kubectl get pods -n kubesphere-system
- Access the KubeSphere Console Once the deployment is complete, you can access the KubeSphere console using the following URL:
http://<your-node-ip>:30880
- Login to KubeSphere Console
Use the following credentials to log in:
Account: admin
Password: P@88w0rd

Kubernetes Dashboard
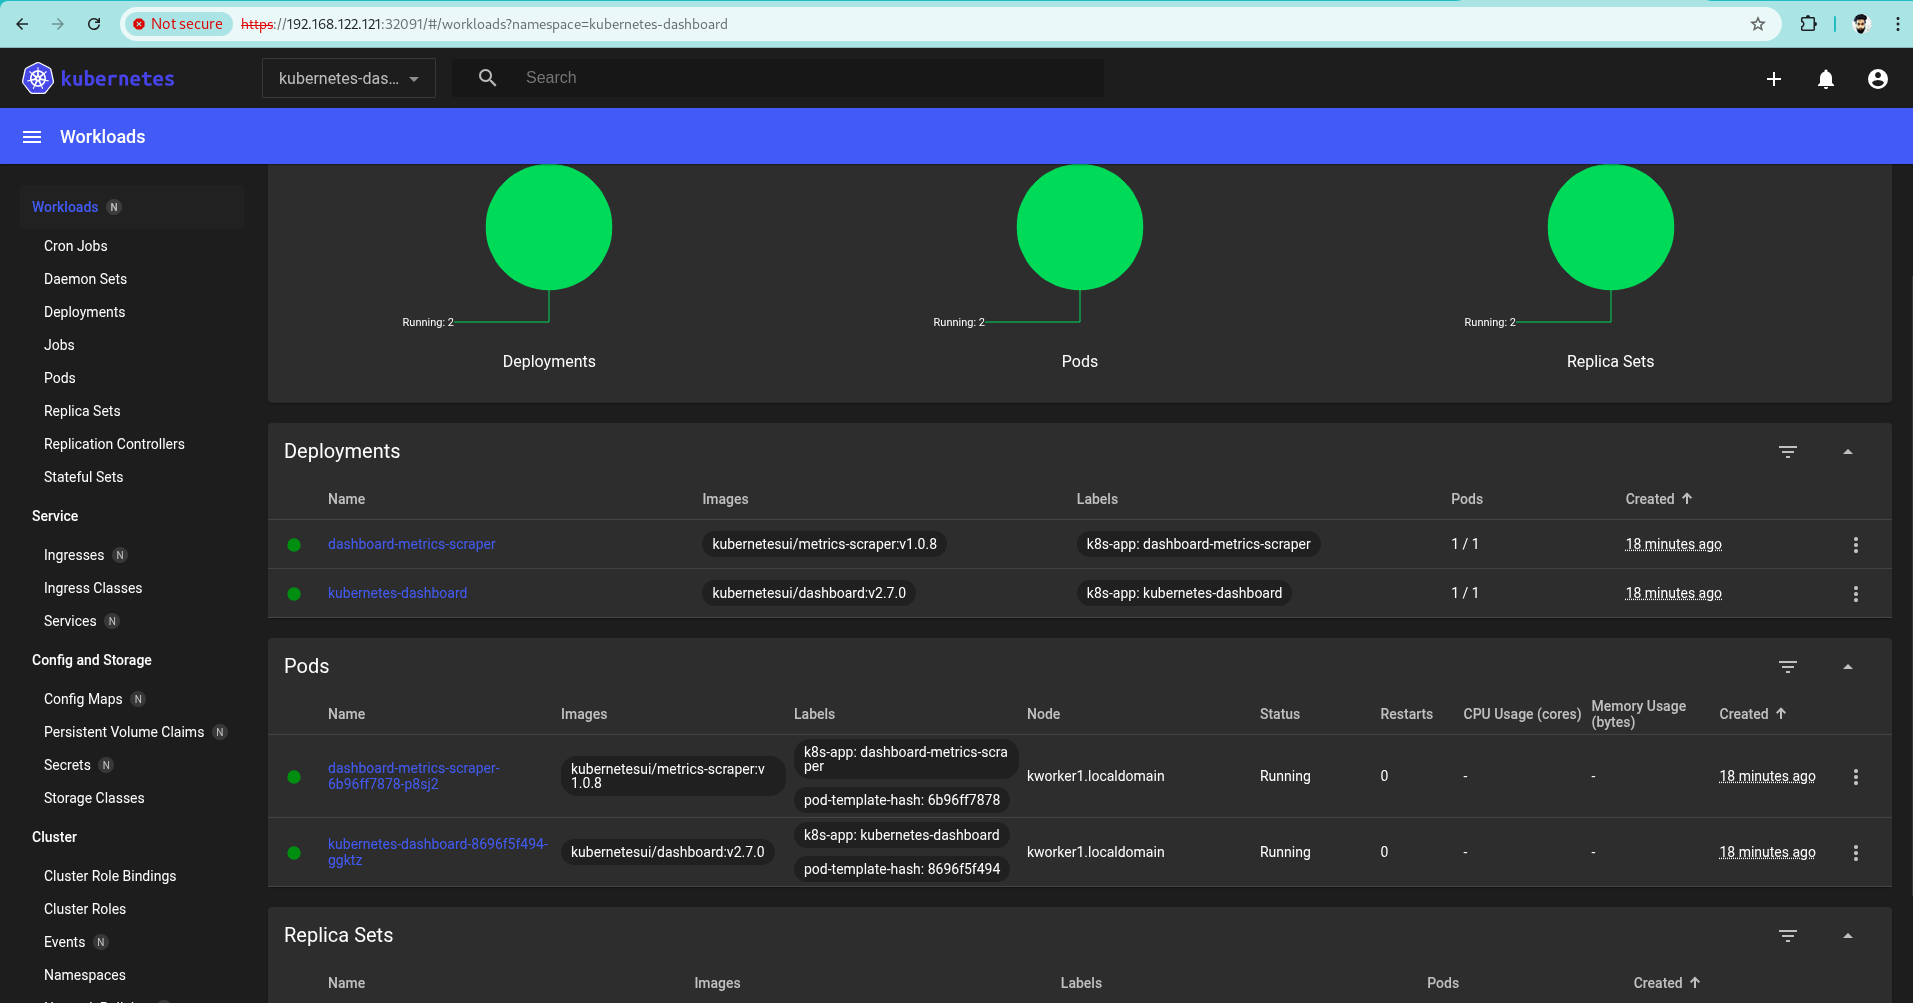
Dashboard also provides information on the state of Kubernetes resources in your cluster and on any errors that may have occurred.
Deploy the Dashboard
1. using Helm
Add kubernetes-dashboard repository
helm repo add kubernetes-dashboard https://kubernetes.github.io/dashboard/
Deploy a Helm Release named “kubernetes-dashboard” using the kubernetes-dashboard chart
helm upgrade --install kubernetes-dashboard kubernetes-dashboard/kubernetes-dashboard --create-namespace --namespace kubernetes-dashboard
2. Apply YAML file
kubectl apply -f https://raw.githubusercontent.com/kubernetes/dashboard/v2.7.0/aio/deploy/recommended.yaml
Create a Service Account (for admin access)
Create a YAML file named admin-user.yaml:
apiVersion: v1
kind: ServiceAccount
metadata:
  name: admin-user
  namespace: kubernetes-dashboard
---
apiVersion: rbac.authorization.k8s.io/v1
kind: ClusterRoleBinding
metadata:
  name: admin-user
roleRef:
  apiGroup: rbac.authorization.k8s.io
  kind: ClusterRole
  name: cluster-admin
subjects:
- kind: ServiceAccount
  name: admin-user
  namespace: kubernetes-dashboard
Apply it:
kubectl apply -f admin-user.yaml
Create Access Token
Run:
kubectl -n kubernetes-dashboard create token admin-user
Save the token output—you’ll use it to log in.
Access the Dashboard
Start a proxy:
kubectl proxy
Now open the Dashboard in your browser at localhost:
http://localhost:8001/api/v1/namespaces/kubernetes-dashboard/services/https:kubernetes-dashboard:/proxy/
1. Port-forward to 0.0.0.0 (Temporary + Simple)
By default, kubectl proxy only binds to 127.0.0.1. You can instead port-forward the dashboard service like this:
kubectl port-forward -n kubernetes-dashboard svc/kubernetes-dashboard 8443:443 --address 0.0.0.0
Then access it from another device using:
https://<your-ip>:8443
2. Expose via NodePort (More Permanent)
Patch the service to be a NodePort:
kubectl patch svc kubernetes-dashboard -n kubernetes-dashboard -p '{"spec": {"type": "NodePort"}}'
Get the exposed port:
kubectl get svc -n kubernetes-dashboard
Look for NodePort under the PORT(S) column—usually something like 30000-32767.
https://<your-node-ip>:<node-port>
Choose “Token” and paste the token you got earlier.